

Aerovy Mobility Inc.
From early 2023 through early 2025, I led the product design vision and UX system development across Aerovy’s three core platforms—Scout, Spectra, and OEM 360—guiding each from concept to deployed product.
To comply with my non-disclosure agreement, I have omitted and obfuscated confidential information in this case study. The information in this case study is my own and does not necessarily reflect the views of Aerovy Mobility Inc.
Redesigning How Airports Understand Energy, Mobility, and Infrastructure
Airports are becoming electrified faster than anyone expected.
Electric ground support equipment (GSE), EV rental fleets, microgrids, renewables, autonomous vehicles, and eventually — eVTOL aircraft.
Yet every operator told us the same thing:
“I know everything about airplanes.
I know nothing about my energy.”
What started as an academic siting model for eVTOL vertiports evolved into a full energy orchestration and fleet operations platform used across continents. Over two years, I led the product design vision that transformed Aerovy from a speculative mobility startup into a deployment-ready infrastructure company.
My Role
From early 2023 through early 2025, I led the product design vision and UX system development across Aerovy’s three core platforms—Scout, Spectra, and OEM 360—guiding each from concept to deployed product.
I worked side-by-side with the CEO to shape product strategy, conduct customer discovery, and evolve the design language across multiple pivots. My role spanned:
Defining experience frameworks for multi-site infrastructure planning, energy orchestration, and fleet operations
Designing end-to-end interfaces across web applications, including topology maps, forecasting dashboards, and asset management flows
Conducting user research with airports, OEMs, utilities, and vertiport companies across four continents
Building scalable design systems to unify DER orchestration, spatial topology, and operational workflows
Supporting business development with prototypes, investor narratives, and customer-specific demonstrations
By the end of my tenure, Aerovy’s platforms had evolved from an academic research concept into a deployed, revenue-generating electrification suite used by international operators.
The Kickoff
From Academic Research to Commercial Product
Aerovy’s earliest foundation came from research developed at Purdue University. Our team’s first product prototype AATLAS blended
commuter flows
demographic clustering
mobility demand
utility infrastructure adjacency
to identify and compare high-potential eVTOL vertiport locations.
In the beginning, the assumption across the industry was:
“Vertiports will form the new mobility network — and someone needs to design where they go.”
Our mission seemed clear, build the siting tool for the early vertiport ecosystem.
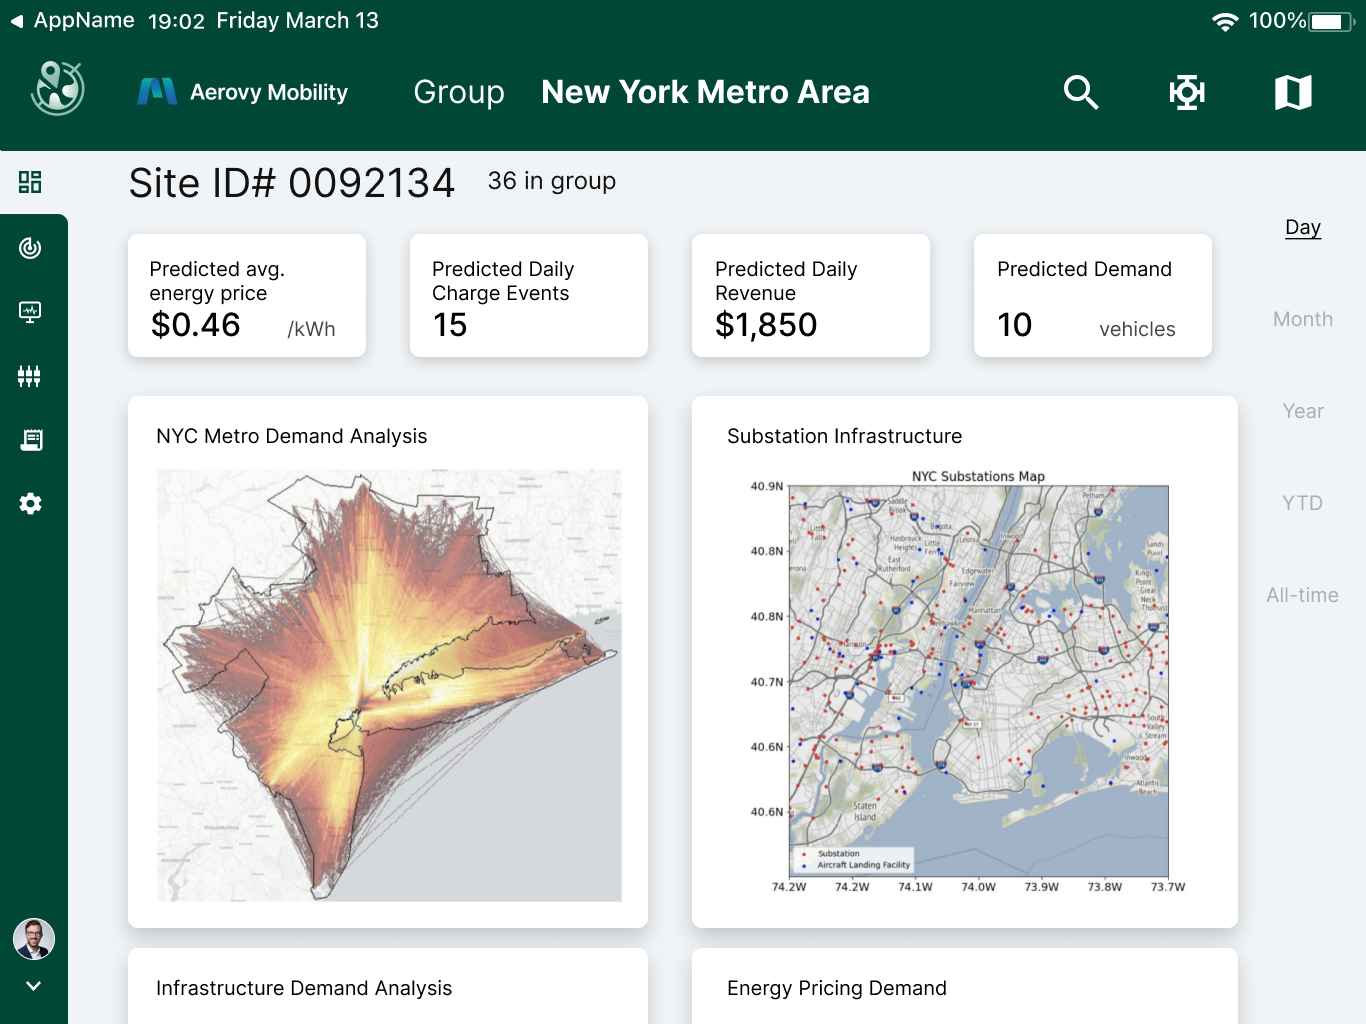
Based on that assumption we built Scout V1, a product initially pitched to vertiport developers and OEMs planning the first urban air mobility networks.
caption for this photo

caption for this photo

caption for this photo
Early traction was promising:
partnerships with leading vertiport companies
strategic airport and OEM partners in Japan, Western Europe, and Australia
recognized legitimacy in the AAM industry
But working with operators on the cutting edge of real-world deployments expanded Scout’s mandate. We needed system-scale visibility, not just siloed sites.
Scout v1
Scout V1 - Defining the N
Before Scout ever reached airports, vertiport companies, or OEMs, we had to make foundational design assumptions about how early AAM planning teams thought and worked. We didn’t yet have access to operators or planners using eVTOL data at scale — no one did. So we relied on first-principles reasoning, mobility analogues, and a structured design framework to shape Scout’s initial direction.
Through initial conversations and field observation I defined three early anchor audiences:
Vertiport Network Developers
exploring where to place new landing sites
AAM OEMs & Airline Partners
Jobs To Be Done
We started with a Jobs To Be Done framework because it gave us a simple way to focus on the real outcomes planning teams needed from Scout.
JTBD helped us understand the core jobs behind AAM planning: screening regions, validating decisions, and communicating findings to stakeholders. That clarity gave the product, design, and engineering teams a shared language before the work became more complex.
validating regional market viability
The fundamental decision models Scout had to support, mapped as actionable Jobs To Be Done.
Service Blueprint
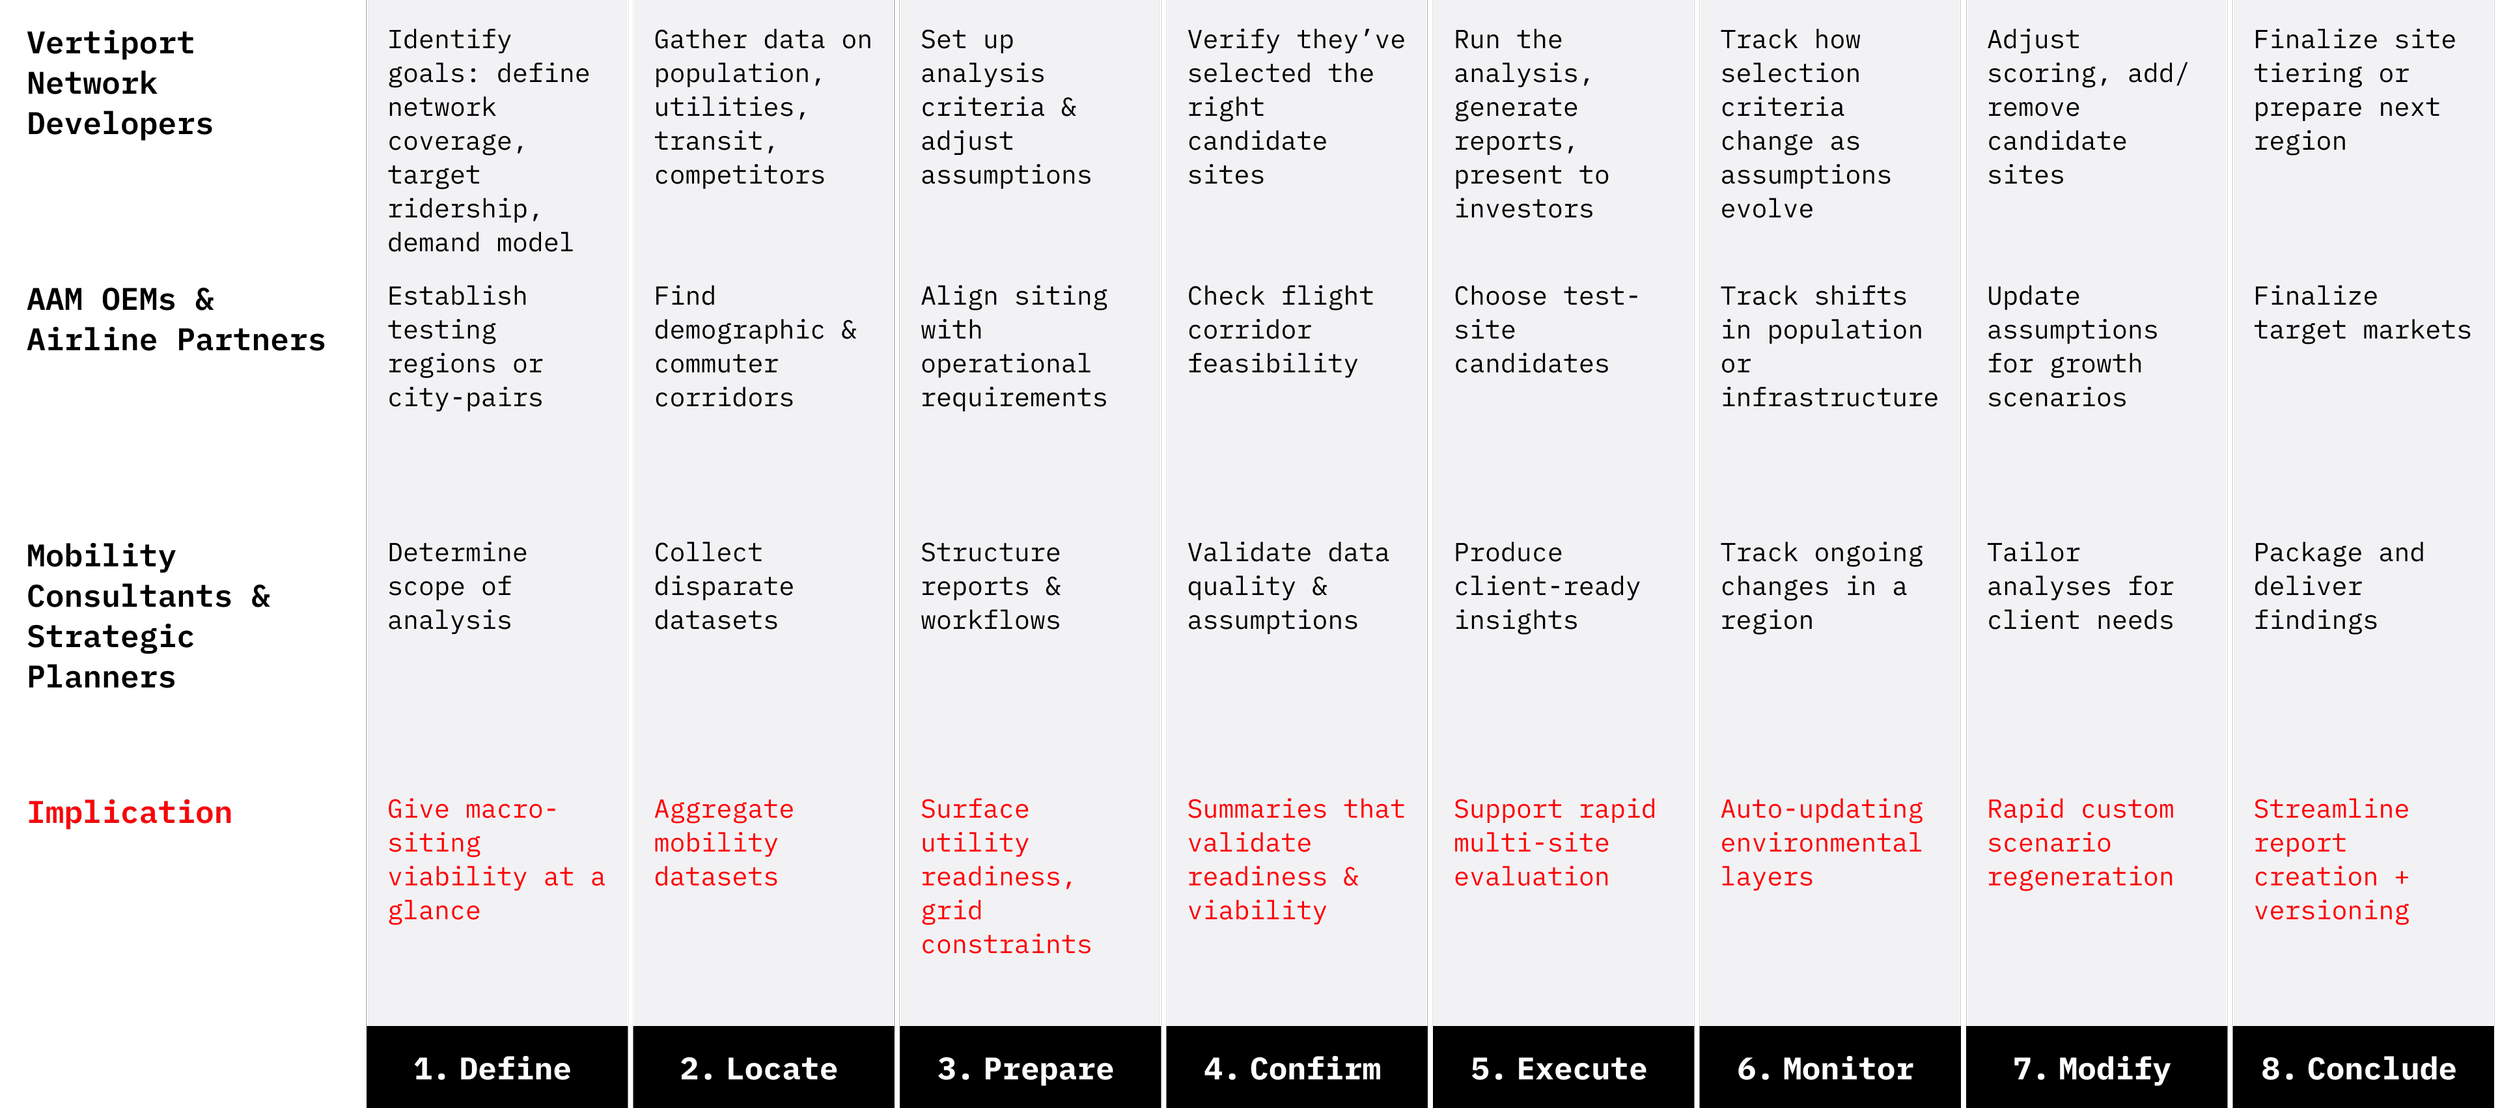
A service blueprint helped us map the full AAM planning process from the first regional scan to site-level validation.
It showed us where teams slowed down. Data gathering, cross-stakeholder alignment, and site validation were all high friction processes where software could meaningfully shorten the path to a defensible siting decision.
Consolidating data sources, standardizing evaluations, and giving planners a repeatable way to move from assumptions to defensible siting decisions would allow teams to focus effort on speed and scale rather than busywork.
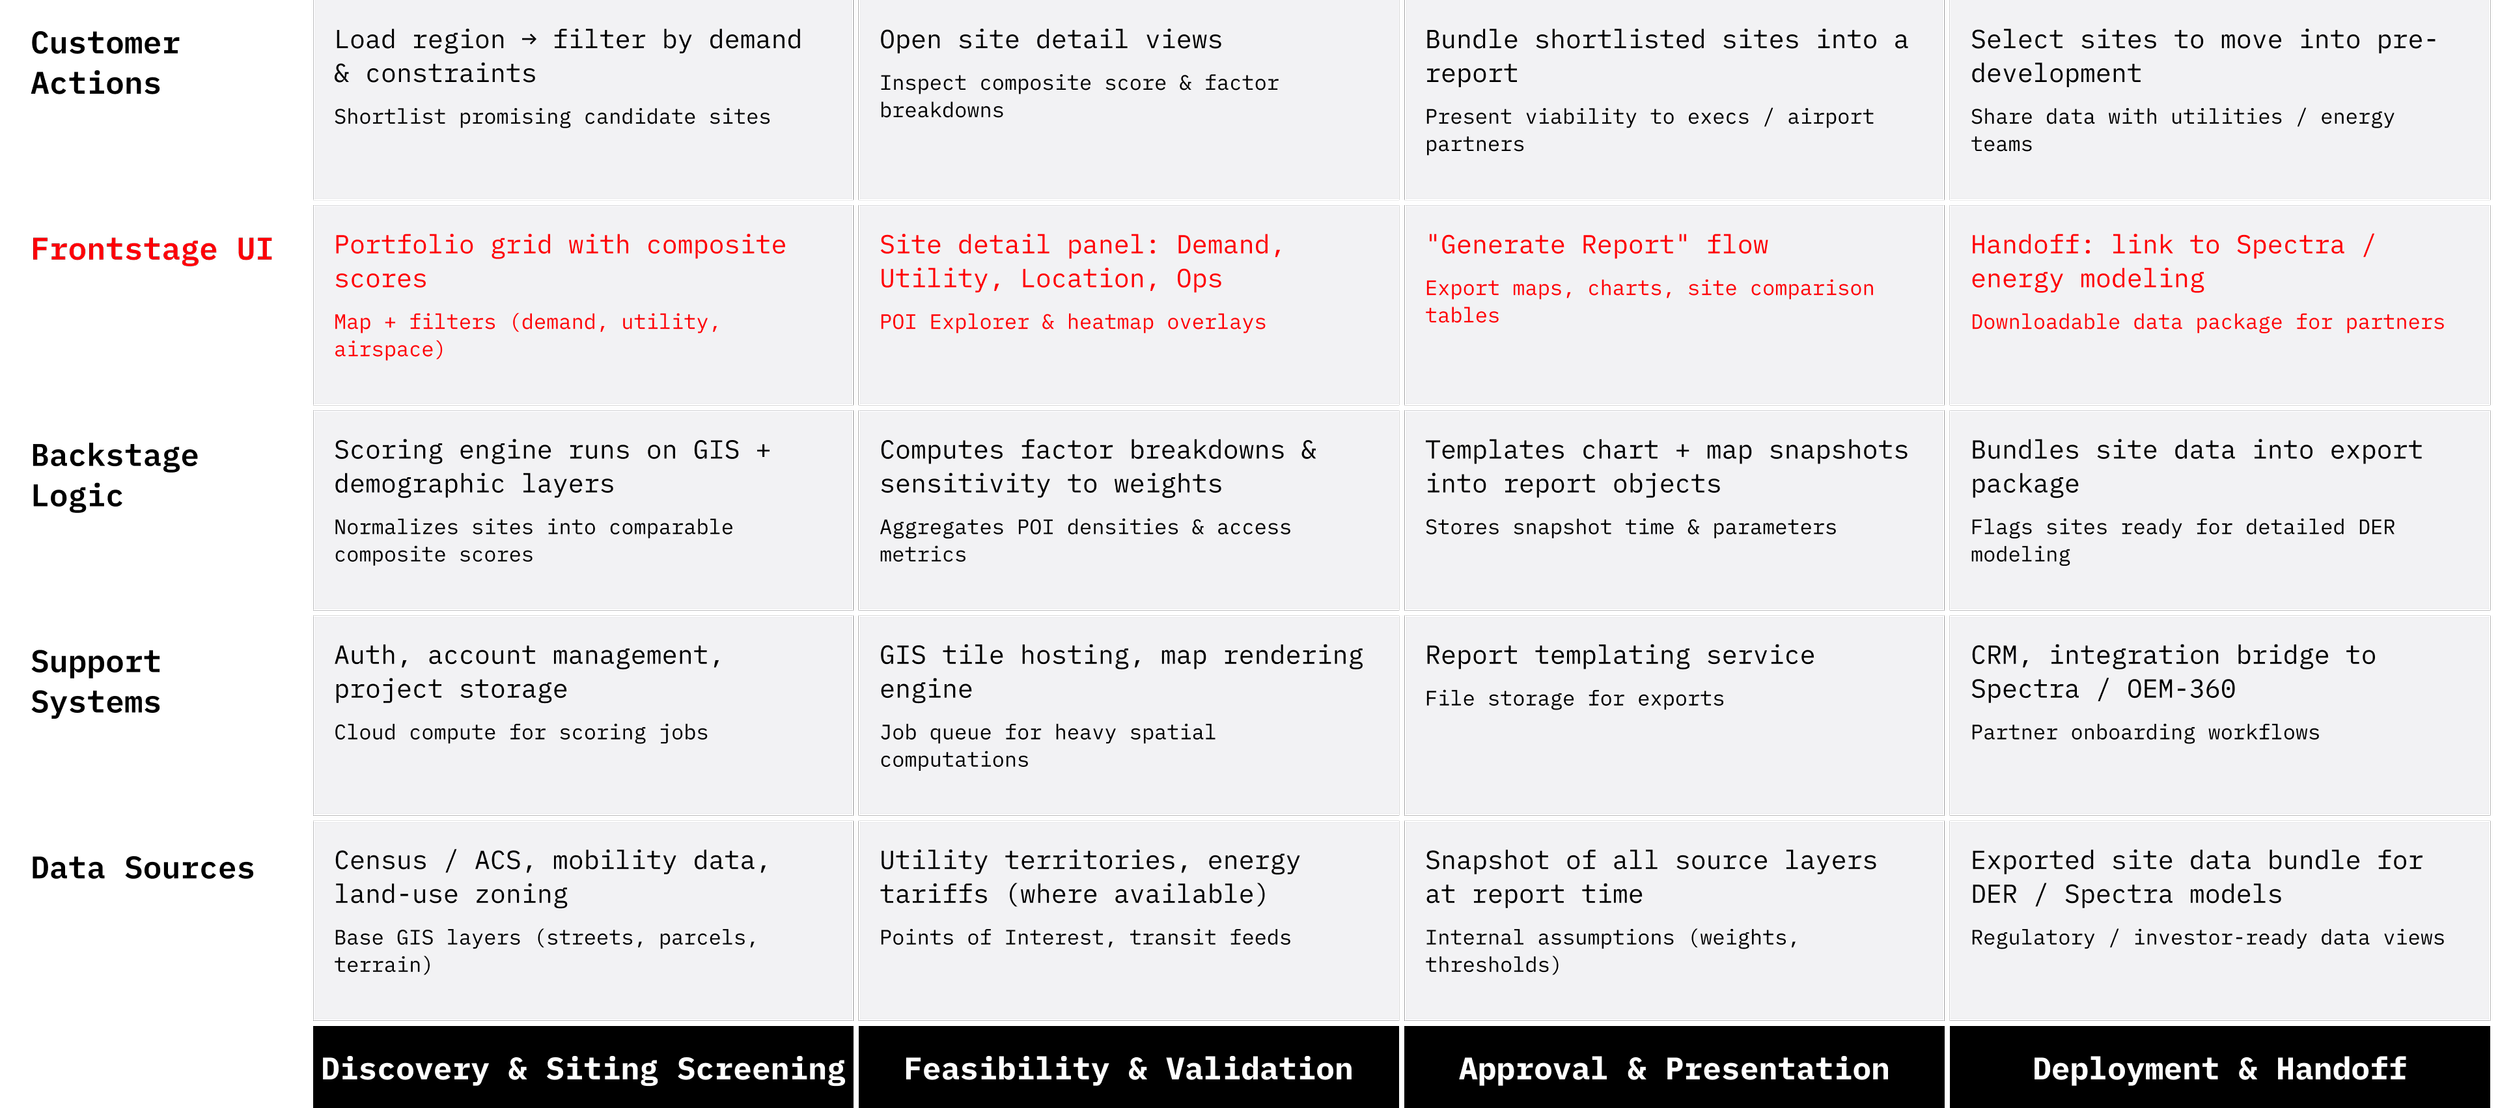
A service blueprint of the AAM planning workflow, showing where Scout can remove friction and standardize decisions.
Systems Architecture
A layered systems architecture diagram captured the essential structure of Scout. It connected the user-facing tools to the underlying engines that calculate viability, visualize geospatial patterns, and assemble reports. Mapping the system this way helped the team align on how information moved through the product and where design and engineering needed to focus.
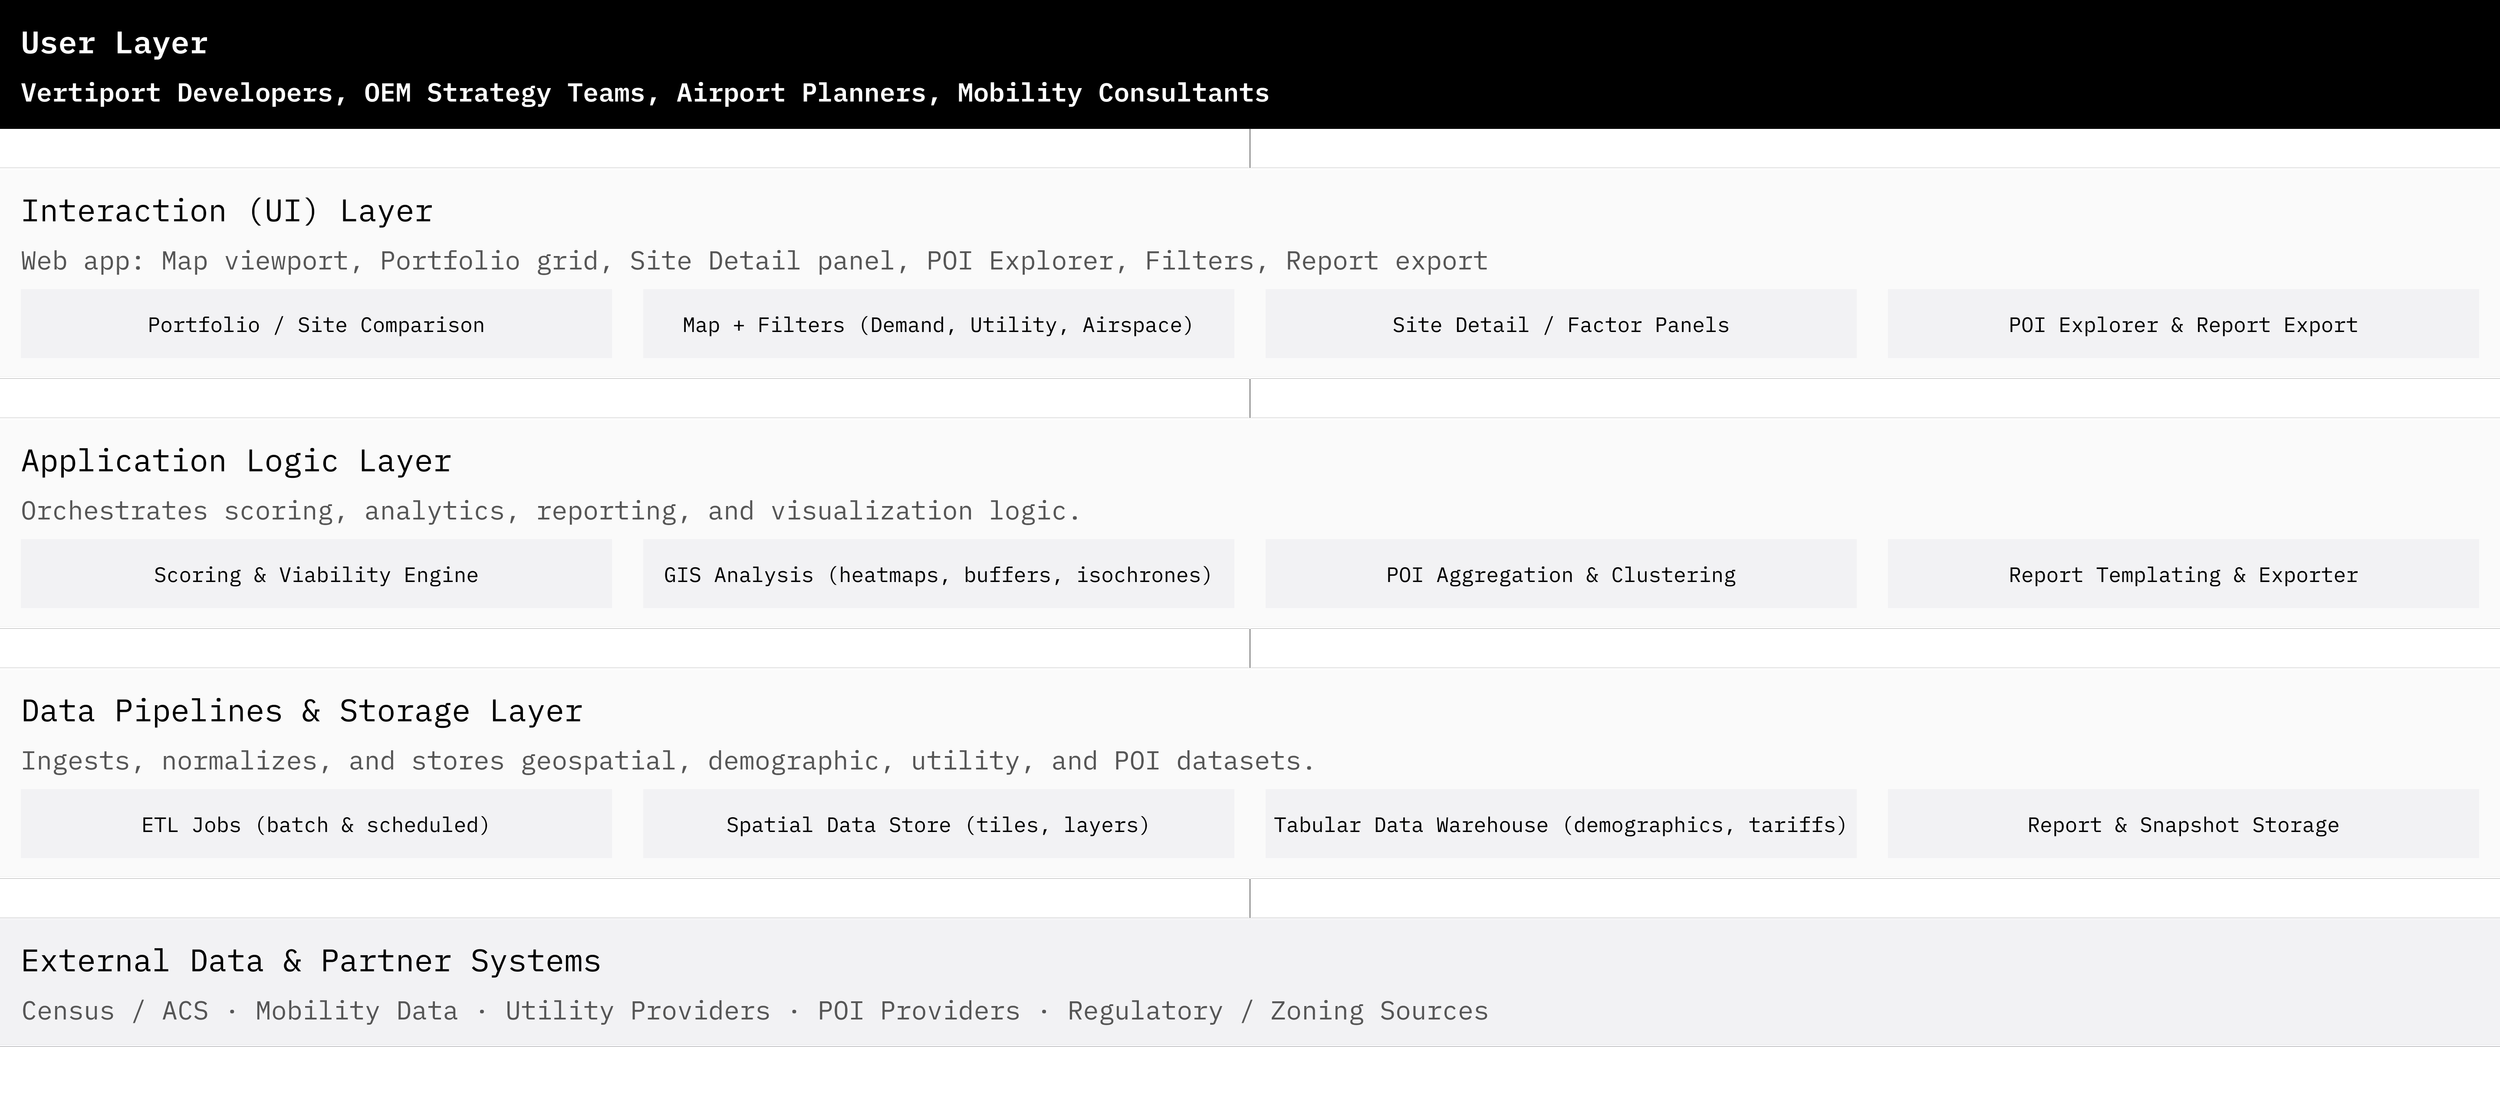
A condensed map of Scout’s system architecture, showing how information moves through the product.
Early Insights
Once we understood the siting workflow we could see where the real friction lived. With a shared mental model of how siting actually functioned across stakeholders we determined structural gaps that software could address.
Mobility Consultants & Strategic Planners
producing defensible planning reports for clients
Siting Decisions Require Multi-Factor Validation
Vertiport developers, OEM planners, and airport teams needed a tool that unified demand, utility, mobility access, and regulatory constraints, because no single factor determined site viability.
Planners Needed Repeatable, Versioned Analyses for Stakeholders
Users needed consistent templates, version control, and a way to re-run analyses with adjusted criteria.
Commuter Flow Patterns Were a Strong Indicator of Future Ridership
Origin–destination patterns, travel time friction, and worker mobility were strong predictors of where vertiports would be viable. This justified heatmaps, demand surfaces, and commuter-based scoring inputs. [amend to include commuter comparison of direct line acccess vs traditional access that would better weight areas like the bay area that were cross-obstacles like water or hills]
POI Context Helped Validate Whether a Location “Made Sense” for Travelers
Vertiport siting wasn’t just infrastructure—it required proximity to attractions, services, and transit nodes that shape human movement.
Disparate Datasets Made Siting Slow and Error-Prone
Teams were manually gathering demographics, commuter flows, utility territories, transit, tariffs, POIs, and zoning from many unconnected sources.
Vertiport Network Developers Needed Defensible Site Selection for Investors
Developers required clear, exportable evidence to justify chosen sites—especially when raising money or negotiating with airports.
scout execution section
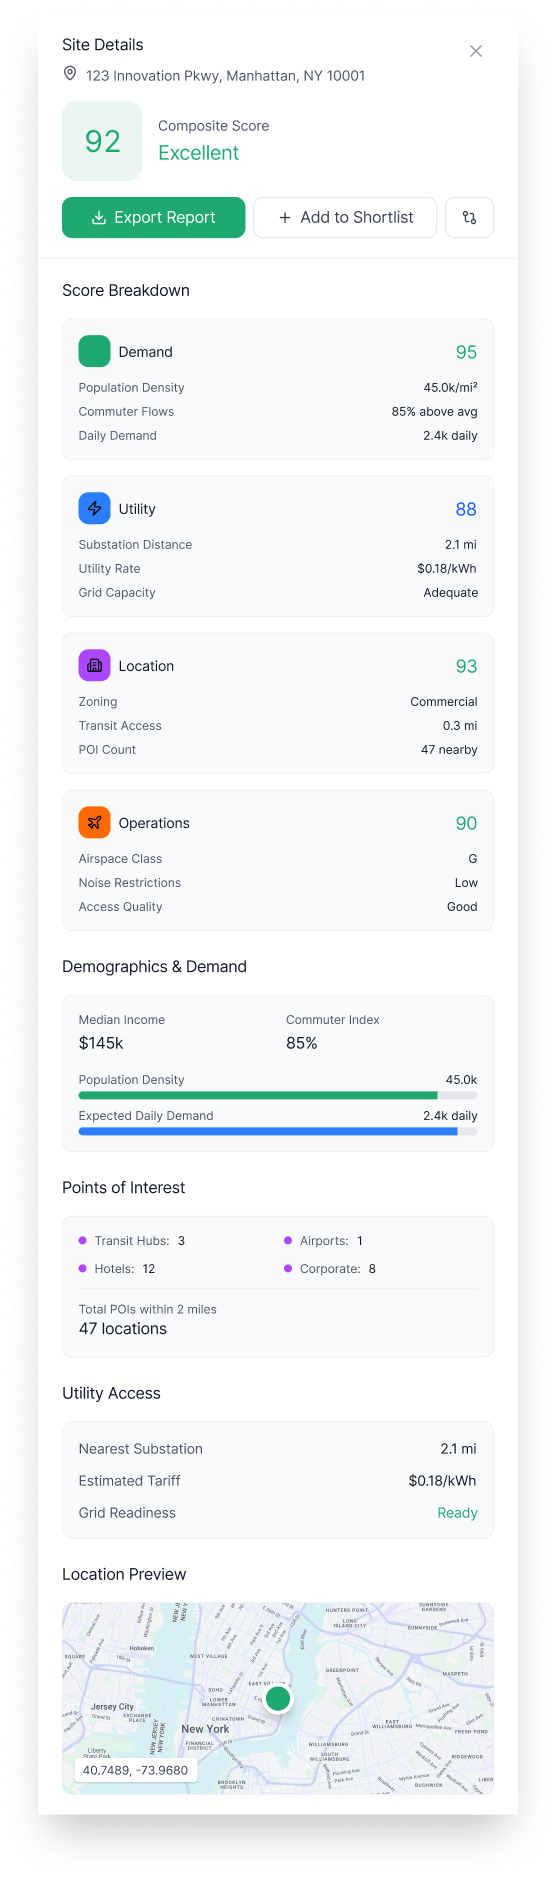
Siting decisions require defensible, multi-factor analysis
Planners needed a transparent model to justify decisions to executives and stakeholders. A composite score with weighted factors provided a repeatable method for ranking sites and communicating tradeoffs.
Composite scoring engine + factor breakdown panel (v1 & v2)
Planners work in portfolios, not single sites.
Teams evaluate 20–200 locations at once. A portfolio grid enables rapid scanning, sorting, and elimination—mirroring real procurement and planning workflows.
Portfolio view + sortable site cards (v1); Advanced portfolio insights header (v2)
4. Macro siting is useful, but teams ultimately need micro-level confirmation.
Map view with heatmaps, buffers, POI pins (v1) and block-level zoning, parcel annotations (v2)
Early siting begins with broad filters, but final decisions depend on parcel accuracy. Moving from regional to street-level precision supported the full siting journey.
5. OEMs and vertiport developers need widely spaced, regional siting for networks.
Region selector + multi-region portfolio support (v1); Cross-region comparison and network mode (v2)
Scout v1 needed to reflect how commercial networks are evaluated—not city-by-city, but corridor-by-corridor. This shaped the region explorer.
6. Household demographics and commuter flows matter more than population density alone.
Layered heatmaps of commuter patterns, income tiers, demand indexes (v1 & v2)
Many traditional siting tools prioritized raw population. But AAM demand behaves differently. These insights prompted more nuanced demand modeling.
7. Decision-makers need defensible, presentation-ready outputs.
Report Exporter (v1) → Configurable Report Builder (v2)
Stakeholders—especially airports—needed PDFs for internal committees, grant applications, and approvals. This made exporting a core workflow.
8. POIs significantly influence siting viability and are central to customer-facing value.
POI Explorer (v1) → Interactive POI clustering + weighted attractiveness scoring (v2)
POIs helped answer: “Is this stop actually useful?” Adding POI analysis validated site demand and brought the user closer to practical forecasting.
9. Airspace constraints limit viable locations more than non-aviation planners expect.
Airspace layers + restricted zone overlays (v1)
Without these, many “good” sites were actually impossible. Early inclusion avoided false positives.
10. Teams want to compare multiple candidate sites side-by-side before choosing one.
Portfolio grid + comparison mode (v1) → Direct “Compare Sites” drawer (v2)
Insights revealed that planners did not evaluate sites in isolation. Comparison needed to be instant, visual, and tied to metrics.
11. Workflow involves toggling between macro trends and micro parcel-level evaluation.
Dual-panel layout (grid + map) in v1 → Tri-panel region header + grid + map + detail drawer in v2
Users constantly switch context. v2 formalizes this with structured, persistent panels.
12. New users need quick filtering rather than raw map exploration.
Sidebar filters (v1) → Saved filter sets + advanced query builder (v2)
Reducing cognitive load and supporting repeatable workflows.
13. Large airports and OEMs think in networks, not individual sites.
Network view in v2
Scout evolved beyond single-site evaluation to corridor-level planning, reflecting real fleet deployment strategies.
14. Planning teams lack a unified source of truth for regional analysis.
Geospatial + demographic + utility unified dataset (v1 architecture) → Modular data catalog in v2
This was a core architectural insight: the value was not the UI alone, but unifying diverse datasets into one tool.
15. Traditional planning tools didn’t support mixed quantitative + qualitative decision criteria.
Factor panel with qualitative insights + notes (v1) → Decision Rationale builder (v2)
Airports needed contextual explanation—not just math—so rationale-building became a design requirement.
16. Stakeholder alignment is often the hardest part of siting.
Exportable comparison views (v1) → Shareable link-based dashboards (v2)
Multiple stakeholders spread across orgs needed asynchronous collaboration. Scouts v2 solves this elegantly.
A. Portfolio & Region Explorer
Purpose: Macro-siting, target region discovery, and multi-site portfolio screening.
Key Capabilities
Region Loading & Filtering
Load cities, metro areas, or custom regions; filter by demand, grid constraints, airspace, or mobility layers.Composite Viability Scores (v2)
Move from simple weighted scores to scenario-sensitive scoring profiles (e.g., commuter-heavy use case, premium-route use case, EV fleet support).Portfolio View
Visual grid of candidate sites with quick-read metrics (e.g., growth indicators, grid warnings, demand bubbles).Network-Level Insights
Heatmaps, corridor analysis, catchment mapping, and underserved region identification.
Problems Addressed
JTBD Step 1–2 (Define & Locate): Provide a structured way to scope regions and gather the right datasets.
Blueprint: Offers the “frontstage” lens through which teams form hypotheses before drilling deeper.
B. Site Detail Workspace
Purpose: Micro-siting validation, feasibility testing, and contextual decision-making.
The Site Detail workspace becomes Scout v2's core canvas.
New & Expanded Panels
Demand Panel (v2)
Dynamic commuter corridors
Market segmentation
Workforce vs. resident demand
Predictive demand curves (assumption-driven)
Utility Readiness Panel (v2)
Substation proximity and inferred load capacity
Tariffs, demand charges, peak/off-peak modeling
Grid risk flags
Smart meter integration (where available)
Location & Mobility Panel
Access to major arterials
Transit adjacency
Mobility friction scores
Walkability and POI clusters
Operations & Feasibility Panel
Construction & permitting considerations
Airspace & regulatory constraints
Environmental factors
Existing infrastructure (parking, pads, rooftop options)
Predictive Scenario Simulator (new)
Users adjust sliders (e.g., demand growth, tariff change, mobility patterns), and Scout recalculates viability.
Problems Addressed
JTBD Step 3–4 (Prepare & Confirm): Align analysis criteria, validate readiness, confirm assumptions.
Blueprint: Supports frontstage tasks where teams inspect factor breakdowns and evaluate tradeoffs.
C. POI Explorer & Contextual Intelligence
Purpose: Provide contextual understanding of community mobility patterns and site attractiveness.
Capabilities
Category-level toggles (Travel & Transit, Shops, Food, Professional Services, Parks, Entertainment)
Proximity scoring (cluster density, weighted importance)
Route accessibility (pedestrian, micro-mobility, vehicular)
Community personas generated from POI composition (optional for v2)
Problems Addressed
Adds human-scale context missing from early Scout iterations.
Supports OEMs and vertiport developers validating whether a site actually meets traveler needs.
Ties to AAM industry insight: many location decisions were pre-determined yet lacked detailed defensibility.
D. Analysis & Reporting Suite
Purpose: Turn analyses into presentations, investor materials, and regulatory documents.
Scout v2 introduces a standardized reporting engine that improves on v1's static PDF exports.
Capabilities
Report Builder: Select maps, charts, tables, and scenarios into an executive-ready deck.
Snapshotting: Capture time-specific data layers to create auditable reports.
Comparative Views: Multi-site comparative tables and spider/radar charts.
Version Control: Track changes in assumptions and data across iterations.
Export Options: PDF, data bundle (CSV/GeoJSON), stakeholder-sharing links.
Problems Addressed
JTBD Step 5–8 (Execute → Conclude): Produces client-ready materials, tracks evolving assumptions, prepares handoffs.
Blueprint: Represents backstage coordination (templating, data bundling).
E. Integration & Handoff to Engineering / Energy Systems
Purpose: Enable downstream design with Spectra or third-party DER models.
Capabilities
Exportable Data Packages
Include utility layers, demand assumptions, geographic bounds, POI snapshots, and risk flags.Energy Sizing Pre-Model
Estimate required charging capacity, preliminary load curves, and candidate microgrid options.Stakeholder Mode
Prepare simplified views for utilities, city planners, or OEM partners.
Problems Addressed
Bridges the gap between siting analysis (Scout) and operational readiness (Spectra).
Meets the real need discovered during customer research: airports require energy insight more than flight insight.
Function Mapping to JTBD & Blueprint
JTBD Stages → Scout v2 Features
Define → Region Explorer, scoring profiles
Locate → GIS data layers, mobility access, POI clustering
Prepare → Assumption builder, scenario weights
Confirm → Site Detail workspace, readiness checks
Execute → Report builder, comparative analysis
Monitor → Auto-updating environmental layers
Modify → Scenario regeneration, weight editing
Conclude → Versioned export packages + handoff tokens
Service Blueprint Layers → Scout v2 Architecture
Frontstage UI → Portfolio, Site Detail, POI Explorer, Report Builder
Backstage Logic → Scoring engine, spatial analytics, clustering algorithms
Support Processes → Data synchronization, assumption tracking, export services
External Systems → Census / ACS / Utility providers / Zoning APIs / Mobility data providers
Summary of the Vision for Scout v2
Scout v2 evolves the product from a screening tool into a decision-support platform that:
Speeds up early siting analysis
Integrates real-world aviation + energy constraints
Reflects how operators, OEMs, and consultants actually plan networks
Supports continuous iteration, not one-off scoring
Smoothly hands off all findings to energy modeling and infrastructure partners
It becomes the shared source of truth for planning next-generation mobility infrastructure.
Utility readiness is a critical blocker and often the least visible.
Airports and municipalities repeatedly cited uncertainty around power availability. Surface-level demographic data was not enough—so utility layers and constraints became first-class features.
Utility overlay layers, substation proximity, tariff data, constraint indicators (v1) and Utility Readiness Module in v2
spectra text
initial feedback section
feedback section that informed changes
feedback on scout
scout v2 feedback and execution
feedback on spectra
spectra v2 feedback and execution
market response
market position and response that inspired oem 360
oem 360
execution on oem 360
The Vision
Energy Management for the Next Generation of Mobility
The goal became clear: build the digital control layer for electrified infrastructure.
Spectra would serve as the unified cloud platform for orchestrating power across airports and fleets, while Scout would model new infrastructure investments and OEM 360 would empower EV manufacturers with operational SaaS.
Our ambition was to replace fragmented utilities and spreadsheets with a coherent, human-centered operating system for energy.
💡 Visual Placeholder: System architecture diagram linking AATLAS → Scout → Spectra → OEM 360.
Frameworks That Guided Design
Jobs to Be Done
We redefined product success around user outcomes, not features.
Executives: recover energy costs, forecast demand, ensure compliance.
Managers: maintain uptime, manage leases, optimize DER assets.
Operators: respond to faults faster, track energy distribution safely.
This job alignment guided every feature, from dashboard summaries to maintenance alerts.
Systems Thinking
Each layer of Aerovy’s platform—data ingestion, visualization, finance—was interdependent.
We built causal maps showing how telemetry data influenced operational and financial outcomes.
This approach helped prevent siloed decisions and allowed us to design a living system, not isolated tools.
Service Blueprinting
We mapped how a single event (like resolving a charger fault) cascaded through the organization:
operations logs updated, invoices recalculated, and sustainability metrics refreshed automatically.
This blueprinting process turned user empathy into enterprise logic.
Human-Centered Systems Design
Designing for airports meant balancing clarity under stress with compliance and control.
We layered complexity behind progressive disclosure, making critical information visible but never overwhelming.
A technician could act within seconds; an executive could understand impact in minutes.
Design Ops & Atomic Design System
To unify Aerovy’s multi-product suite, I built an atomic component library shared across all platforms.
It standardized UI language, improved accessibility, and reduced engineering overhead—enabling consistent design delivery across continents.
The Framework In Action
Scout — Predictive Planning
Derived from Purdue’s AATLAS research, Scout used demographic and commuter data to simulate future eVTOL demand and DER infrastructure needs.
It modeled site viability, power access, and ROI—transforming academic algorithms into actionable business intelligence.
Spectra — Unified Orchestration
Spectra evolved into the central cloud interface for managing distributed energy resources.
Combined abstract data dashboards and geospatial maps.
Enabled automated billing and load balancing using APIs like UtilityAPI and OCPP.
Incorporated smart meter integrations for legacy facilities.
Introduced role-based access controls to meet NIST and FAA cybersecurity standards.
OEM 360 — Fleet Software as a Service
Insight from a major Midwest logistics hub reframed our focus toward enterprise fleet management.
Their goal was to electrify ground support equipment (GSE) across multiple shipping partners.
We built OEM 360 to enable OEMs to offer fleet analytics, usage tracking, and billing dashboards directly to customers — turning hardware sales into SaaS revenue.
🖼️ Visual Placeholder: Three product visuals — Scout (simulation view), Spectra (DER orchestration UI), OEM 360 (fleet dashboard).
Scaling Challenges
Scaling Challenges
Designing across infrastructure, security, and policy was as much diplomacy as design.
Here’s how we met six key challenges.
1. Data Model Complexity
Unified disparate DER data into a single normalized schema.
Built abstraction layers to handle inconsistent APIs, timestamps, and units.
Added anomaly detection to prevent corrupted billing.
2. UI Scalability
Designed modular dashboards that adapted to user role and device.
Created responsive layouts bridging map-based and analytic contexts.
Reduced clutter by surfacing KPIs contextually to each workflow.
3. Security & Compliance
Introduced role-based visibility and secure logging for operational access.
Embedded security heuristics into UI (e.g., visual cues for restricted data).
Proposed API flagging and smart-meter retrofits for non-networked systems.
4. Organizational Buy-In
Used stakeholder mapping to identify influence networks inside each airport.
Developed custom prototypes for execs, operators, and utilities.
Demonstrated ROI alignment between regulatory, operational, and financial goals.
5. Hardware Limitations
Partnered with hardware vendors to design retrofit smart meters.
Enabled early deployments even at airports without IoT infrastructure.
Proved digital value before major capital expenditures were made.
6. Product Expansion
Refactored data models to treat all assets as DER-agnostic.
Adapted UI and units for seaports, universities, and Indonesian grid contexts.
Created scalable architecture for future sectors beyond aviation.
⚙️ Visual Placeholder: Grid of six cards—each representing one scaling challenge, with mini diagrams.
The Execution
From flying taxis to distributed energy orchestration [placeholder]
Our process was iterative, cross-disciplinary, and global.
We built, tested, and deployed in rapid loops, combining deep technical collaboration with stakeholder storytelling.
Wireframing & Prototyping: over 50 iterations across Spectra and Scout.
User Testing: with 6 airports, 2 OEM partners, and 1 university utility.
Cross-Functional Delivery: coordinated design with engineers and consultants.
Business Development Support: designed investor decks and sales demos that helped close Aerovy’s $800K pre-seed round.
By 2024, we had evolved from simulation software to a deployable enterprise platform.
🎥 Visual Placeholder: Sequence of prototypes evolving into live dashboards.
The Vision
A scalable platform for electrification and beyond
With these insights, we set a clear vision:
Build Spectra, a platform to unify DERs—chargers, batteries, microgrids, HVAC, and more—into one scalable control system.
Design interfaces flexible enough to serve both executives (abstract dashboards, financial summaries) and operators (spatial, location-based device maps).
Position Aerovy as a cross-industry electrification platform—valuable not just for airports and vertiports, but also for seaports, mobility hubs, and electric fleet operators.
This vision led to three major outcomes:
First real-world deployments → including a revenue-generating launch in Indonesia.
Global partnerships → with airport, vertiport, and infrastructure partners across four continents (Japan, Australia, U.S., and more).
Expansion into OEM SaaS → with OEM 360, enabling electric vehicle manufacturers to offer white-labeled fleet management software and unlock SaaS revenue margins.
By reframing our work around electrification rather than speculative eVTOL operations, we created a product suite that addressed present-day customer needs while preserving relevance for the future of mobility.
The Service
From prototypes to deployed platforms
Out of our discovery and vision came three core platforms:
Spectra – An energy orchestration system that unified distributed energy resources (DERs) such as chargers, batteries, HVAC, and microgrids. Its interface supported multiple mental models:
Abstract dashboards for executives, summarizing cost, revenue, and system health.
Spatial layouts for operators, showing physical orientation of devices across facilities for faster troubleshooting and reduced time-to-resolution (TTR).
Scout – A simulation and planning tool for airports and mobility hubs to model future electrification needs. Scout helped stakeholders forecast demand, size infrastructure, and justify capital expenditures.
OEM 360 – A white-labeled fleet management platform for electric vehicle manufacturers. It allowed OEMs to monetize their vehicles with SaaS offerings, giving their customers dashboards for fleet health, utilization, billing, and charging data.
By mid-2024, Aerovy had its first revenue-generating deployment in Indonesia, with OEM 360 as the spearhead product. Meanwhile, Spectra and Scout remained strategic differentiators for airports and energy-sensitive partners across four continents.
The Framework
Designing systems that scale across industries
The complexity of these platforms demanded a robust design framework:
Multi-tiered user research → We mapped needs across executives, managers, and operators, ensuring the platforms worked at both macro (financial and regulatory) and micro (on-site operational) levels.
Flexible UI systems → I developed a design language capable of representing DERs in both abstract data dashboards and spatial, facility-oriented maps, accommodating everything from financial rollups to physical asset tracking.
Revenue-aligned insights → My research showed airports were motivated more by operational cost reduction and lease revenue visibility than by futuristic vehicle turnaround. This shifted our product framing toward DER unification and financial reporting, ensuring the platform spoke to actual business incentives.
Scalable design systems → I created component libraries and interaction patterns, ensuring consistency across Spectra, Scout, and OEM 360, and enabling faster iteration as we entered new industries like seaports and mobility hubs.
This framework allowed us to adapt Aerovy’s platforms to very different customers — from Indonesian OEMs to U.S. hub airports — without fragmenting the core design language.
The Impact
From early vision to global deployments
Despite resource constraints, the design work delivered meaningful outcomes:
Successful pre-seed raise ($800K) → Investor storytelling and design collateral directly supported Aerovy’s funding at an $11M valuation, with backing from Purdue Innovates, M25, Flywheel Fund, and incubation with a top-20 VC.
Team growth → Helped scale the company from 4 to 10 members, including leading a consulting team of 12 business students who reported to me during critical phases.
Strategic partnerships across 4 continents → Supported business development with airports in the U.S., vertiport developers in Japan, energy partners in Australia, and OEM deployments in Indonesia.
Revenue generation → Brought Aerovy to its first revenue-generating deployment with OEM 360 in Indonesia, transitioning the company from R&D into active commercial operations.
Media recognition → Aerovy was featured in Business Insider, TechPoint, and M25’s investment blog as a leader in digital operations for advanced air mobility.
The Validation
Testing in the field
Once we had functional prototypes and early deployments, validation became critical. Because Aerovy’s platforms spanned multiple user tiers — from C-suite executives to field technicians — testing required different methods at each layer:
Conferences & pilots → We used industry conferences and pilot proposals with airports to test messaging and workflows with real decision-makers. This highlighted that our early AAM-focused framing (supporting eVTOL turnaround and aircraft scheduling) was less compelling than DER unification and revenue visibility.
Operational testing → With regional airports and international partners, we validated operator-level flows: error reporting, device orientation, and system troubleshooting. These sessions emphasized the need for faster time-to-resolution (TTR) and clear spatial mapping of devices.
Revenue feedback loops → Early deployments of OEM 360 in Indonesia showed customers valued white-labeled SaaS features — billing, fleet dashboards, and utilization reporting — as direct business enablers. This validated the pivot from aviation-exclusive software to a broader OEM-first strategy.
We also discovered pain points that forced iteration:
Operators struggled with data overload → led to granular filtering and summarized reporting.
Executives cared about lease revenue and operating costs, not technical DER details → led to tiered views with financial rollups.
Partners demanded extensibility across industries → pushed us to abstract the design language so it could scale from airports to seaports, mobility hubs, and beyond.